

How to Read Car Specs Like a Pro: Power-to-Weight, Gearing, Aerodynamics (Plus a Winter Driving Addendum)
How to Read Car Specs Like a Pro: Power-to-Weight, Gearing, Aerodynamics (Plus a Winter Driving Addendum)
Brochure numbers can be misleading. Two cars with the same horsepower can feel totally different. This depends on weight, gearing, tire grip, and aerodynamics. Once you know what to look for, a spec sheet becomes a shortcut to predicting how a car will actually accelerate, brake, and feel at speed.

Understanding car specs is key for making smart choices. It’s not just about horsepower or torque. It’s about power-to-weight ratio, gearing, and aerodynamics. This guide breaks down these complex topics in simple language. It also includes a winter driving reality check, where tires and temperature change the rules.
Key Takeaways
- Understand the importance of power-to-weight ratio in car performance.
- Learn how gearing affects acceleration and overall driving experience.
- Discover the role of aerodynamics in a car’s speed and handling.
- Adjust your expectations for winter driving conditions.
- Use spec sheets to predict real-world car performance.
The Art of Reading Car Specs Beyond Marketing Hype
To really understand a car’s performance, you must look beyond the marketing. Car makers often show data that makes their cars look better. They hide the not-so-good stuff.
Why Brochure Numbers Often Mislead
Brochure specs can be tricky because of how they measure things. For example, horsepower can be different depending on where it’s measured. The Society of Automotive Engineers (SAE) tries to standardize these numbers. But, there’s a difference between SAE horsepower and metric horsepower (PS) that can confuse people.

Developing a Systematic Approach to Spec Analysis
To really get into car specs, you need a plan. First, look at the power-to-weight ratio and the torque-to-weight ratio. These tell you about a car’s speed and how it handles. Also, check out the torque curve to understand how the car drives in real life.
For more on car spec analysis, check out this guide. It dives deep into car specs, including gearing, aerodynamics, and how cars do in winter.
Power-to-Weight: The Foundation of Performance
The power-to-weight ratio is key to a vehicle’s speed and performance. It’s a measure car lovers and engineers use to judge a car’s speed. This ratio is very important.

Calculating and Understanding HP/Ton
To find the power-to-weight ratio, divide the car’s horsepower by its weight in tons. For example, a car with 400 horsepower and 1.5 tons weighs has a ratio of 266.67 hp/ton. This shows how fast your car can go. A higher ratio means better speed.
Understanding HP/Ton is key because it shows how fast your car can go. A sports car with a high ratio will beat a heavier car with the same power.
Torque-to-Weight Ratio: The Real Acceleration Indicator
The torque-to-weight ratio is better at showing a car’s speed. Torque is the force that turns the wheels. It shows how well a car can start moving.
A car with a high torque-to-weight ratio can start moving faster. This is why diesel cars, with more torque, can be quicker than gasoline cars, even with less power.
Weight Distribution and Its Performance Implications
Weight distribution affects how a car handles and speeds up. A car with more weight in the back is more agile. A car with more weight in the front may not turn as well.
For example, a sports car with the engine in the back handles differently than an SUV with the engine in the front. This changes how they speed up and turn.
Torque Curves vs. Peak Numbers
When looking at a car’s performance, it’s key to know the difference between torque curves and peak numbers. Peak horsepower and torque are often talked about, but they don’t show the full picture. The torque curve, which shows how torque changes with RPM, gives a better look at an engine’s performance.
Why Area Under the Curve Matters More Than Peak Values
The area under the torque curve shows an engine’s power delivery. A wide, flat torque curve is better than a sharp one for consistent acceleration. For example, a turbocharged engine can make a lot of torque over a wide RPM range. This makes it versatile in different driving situations.

Identifying Usable Powerbands
Knowing the usable powerband is key to understanding a car’s performance. The powerband is the RPM range where the engine makes its most useful power. A wider powerband means a car is easier to drive, as it works well in various situations.
Naturally Aspirated vs. Turbocharged Torque Characteristics
Naturally aspirated and turbocharged engines have different torque traits. Turbocharged engines make more torque at lower RPMs because of the forced air. Naturally aspirated engines have a more even torque delivery, peaking at higher RPMs.
| Engine Type | Torque Characteristics | Typical RPM Range for Peak Torque |
|---|---|---|
| Naturally Aspirated | Linear torque delivery, peaking at higher RPMs | 5,000-7,000 RPM |
| Turbocharged | Significant torque at lower RPMs, thanks to forced induction | 1,500-4,000 RPM |
By looking at the torque curve and understanding engine types, you can really appreciate a car’s performance.
How to Read Car Specs for Gearing and Transmission
Knowing about gearing explained in car specs is key to judging a car’s performance. Gearing affects how power gets to the wheels, impacting speed and acceleration.

Final Drive Ratios and Their Effect on Acceleration
The final drive ratio is vital in a car’s gearing system. It’s the last step before power hits the wheels. A higher ratio means more torque, which boosts acceleration but might cap top speed.
For example, a car with a high final drive ratio might zoom from 0-60 mph fast. But it might not reach as high a top speed as a car with a lower ratio.
Final drive ratios work with the transmission’s gear ratios explained in simple terms. They decide how engine power turns into wheel speed. The right final drive ratio can make a car quicker and more responsive.
Gear Ratio Spacing and Shift Points
Gear ratio spacing is about how gears are lined up. A close ratio gearbox has tight spacing for smoother acceleration. But a wide-spaced gearbox is better for high speeds or racing.
Knowing about shift points is also key. The right shift timing keeps the engine in its sweet spot, boosting acceleration and efficiency. Modern transmissions, like those with advanced gearing, use smart logic for better performance.
Calculating Theoretical Top Speed from Gearing
To figure out a car’s top speed, look at its gearing. You need the final drive ratio and the highest gear ratio. Use a formula that includes engine RPM, gearing, and wheel size to find the theoretical top speed.
A car with long gearing is made for high-speed driving. But a car with short gearing is for quick starts. Knowing this helps you choose a car based on what you need.
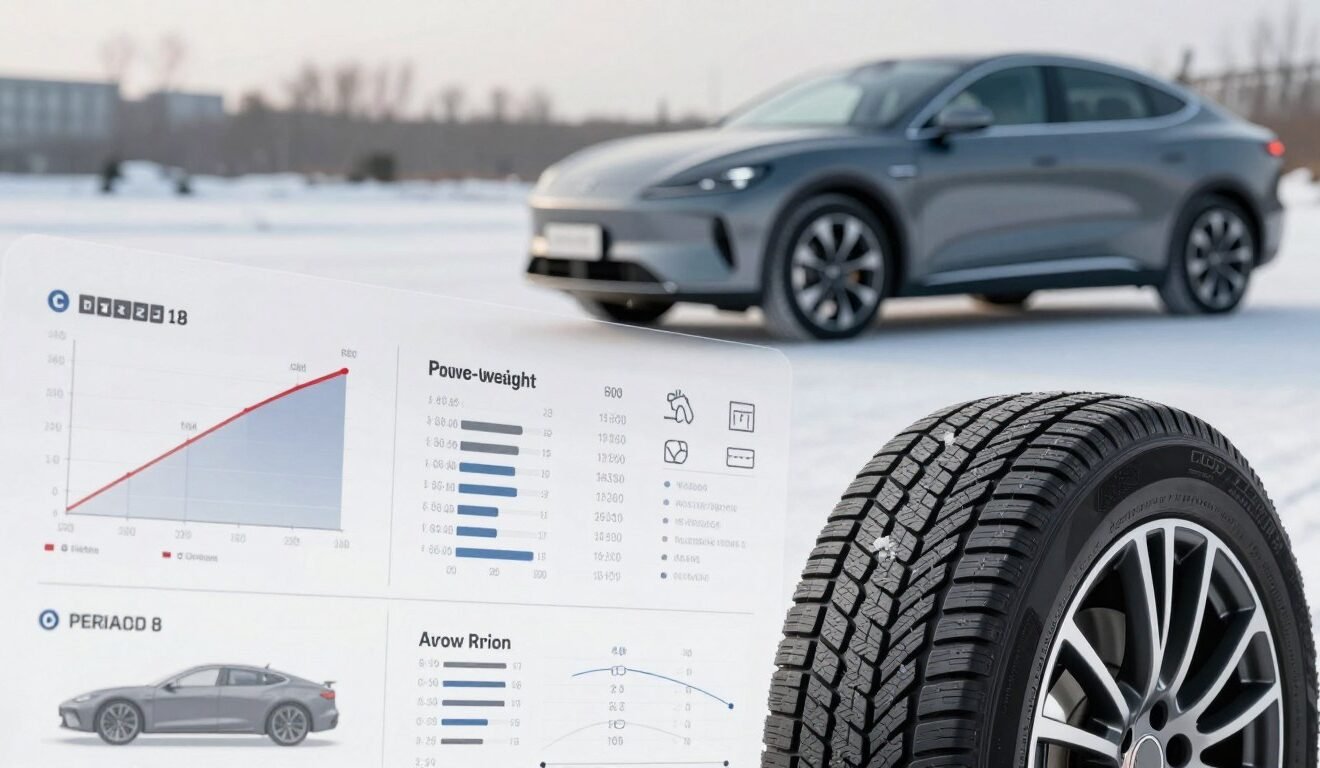
Tire Specifications and Their Performance Impact
Knowing about tire specs is key to seeing how well a vehicle performs. Tires are the only part of the vehicle that touches the road. So, their specs are very important for how the vehicle handles, speeds up, and brakes.
Decoding Tire Size Markings
Tire size markings tell you a lot about a tire. For example, “225/40R18” shows the tire’s width (225 mm), its shape (40%), and the rim size (18 inches). The width of the tire affects how well it grips the road and how it handles. A wider tire grips better but might make the vehicle roll more.

Compound Types and Their Grip Characteristics
The type of tire compound greatly affects how well it grips. Softer compounds grip better but wear out quicker. Harder compounds last longer but don’t grip as well. Knowing about tire compounds helps pick the right tires for different driving needs.
| Compound Type | Grip Level | Durability |
|---|---|---|
| Soft | High | Low |
| Medium | Medium | Medium |
| Hard | Low | High |
Sidewall Height and Its Effect on Handling
The height of the tire’s sidewall, shown in the aspect ratio, impacts handling. Lower sidewalls improve handling but can make the ride harsher. The sidewall height is important for the vehicle’s performance and comfort.
As Motor Trend points out, “The tire is the most critical component of a vehicle’s suspension system, influencing both handling and ride quality.” This shows why looking at tire specs is essential for evaluating a vehicle’s performance.
In summary, knowing about tire specs is vital for a vehicle’s best performance. By understanding tire size markings, compound types, and sidewall height, you can choose the right tires for your vehicle.
Braking System Analysis
The braking system is key to a vehicle’s performance. It ensures safety, handling, and a good driving experience. To judge a car’s braking, you must look at several important parts and their details.

Rotor Size in Relation to Vehicle Weight
The size of brake rotors is vital for braking performance. Bigger rotors mean more surface area for pads to grip. This helps in cooling and reduces brake fade.
Heavier vehicles need larger or more efficient brakes. This is because they require more stopping power. High-performance cars often have bigger rotors to handle their speed and power.
Pad Types and Heat Management
Brake pad material greatly affects a vehicle’s braking. Different materials offer different levels of friction, wear, and heat tolerance. For example, semi-metallic pads are good at cooling but can be noisy and wear out faster.
Organic pads are quieter and make less dust but may not handle heat as well. Heat management is key in brake pad design. Too much heat can cause brake fade and reduce stopping power. Knowing the type of brake pads used is important for judging a car’s braking.
Identifying Potencial Brake Fade Issues
Brake fade happens when the brakes get too hot, losing power. It’s common during hard braking, like on mountains or track days. To spot brake fade risks, look at rotor design, pad type, and vehicle weight.
Drivers who push their cars hard need to know these details for safe braking. For more on preparing for track days, including brake tips, see our guide: Track Day 101: The Complete Prep.
Suspension Clues in the Spec Sheet
To really get a car’s handling, you must look deeper than just specs. The suspension geometry is key to its performance, stability, and how it responds.
Wheelbase and Track Width Effects on Stability
The wheelbase and track width are vital in a car’s suspension. A longer wheelbase makes a car more stable, which is good at high speeds. It helps prevent the car from tilting or yawing too much.
A wider track width helps with cornering. It makes the car less likely to roll and better at fighting lateral forces.
| Dimension | Effect on Stability | Cornering Impact |
|---|---|---|
| Longer Wheelbase | Increased stability at high speeds | Reduced pitch and yaw |
| Wider Track Width | Improved cornering stability | Reduced body roll |
Camber Capability and Cornering Performance
Camber capability is about how well a car sticks to the road in corners. Cars with more negative camber can corner faster because they wear tires more and grip better. But too much negative camber can cause uneven tire wear and make the car unstable in a straight line.

Ride Height and Center of Gravity Considerations
The ride height and center of gravity are linked. Lowering a car can lower its center of gravity, which improves handling by reducing roll and making it more responsive. But finding the right balance is key to avoid scraping or losing control on rough ground.
Aerodynamics: Beyond the Drag Coefficient
Aerodynamics is key to a car’s performance, more than just the drag coefficient. To judge a car’s aerodynamics, look at several factors. These factors affect its performance and efficiency.
Understanding Cd, Frontal Area, and CdA
The drag coefficient (Cd) shows a car’s aerodynamic drag compared to its frontal area. But Cd alone isn’t enough. The frontal area is also vital, as it shows how much air the car must move. CdA, the product of Cd and frontal area, gives a fuller picture of a car’s drag.
For example, a car with a high Cd but small frontal area might have similar CdA to one with a low Cd but large frontal area.
Downforce vs. Drag Tradeoffs
High-performance cars often have to choose between downforce and drag. Downforce improves cornering stability but increases drag. This can lower top speed and raise fuel use. Makers must find the right balance for the best performance.
For instance, a Formula 1 car might focus on downforce for better cornering. A hypercar might aim for less drag to reach higher speeds.
Cooling Requirements and Performance Compromises
Cooling is another key part of aerodynamics. Cars need airflow to cool their engines and brakes. But this airflow can also increase drag.
Manufacturers use air curtains and special cooling ducts to lessen these effects. If you want to learn more, check out best budget sports cars under $15,000.
Knowing about these aerodynamic factors helps you choose the right car. By looking at Cd, frontal area, CdA, and the downforce vs. drag tradeoffs, you can understand the complex world of car aerodynamics.
Practical Application: Comparing Popular Cars
Car performance is often hidden in the details. It’s key to compare specs closely. Don’t just look at the marketing; dive into the specs.
Case Study 1: Sports Sedan Comparison
Let’s look at the BMW M3 and Mercedes-AMG C63, two top sports sedans. The BMW M3 has a power-to-weight ratio of 4.4 lbs/hp. The Mercedes-AMG C63 is at 4.1 lbs/hp. This shows the C63 might be faster.
- BMW M3: 473 HP, 4,272 lbs curb weight
- Mercedes-AMG C63: 503 HP, 4,078 lbs curb weight
Case Study 2: Hot Hatchback Analysis
Now, let’s check the Volkswagen Golf GTI and Honda Civic Type R. The Civic Type R has a gear ratio for quick starts. But, the Golf GTI’s torque curve is better for daily driving.
- Volkswagen Golf GTI: 228 HP, 3,086 lbs curb weight
- Honda Civic Type R: 306 HP, 3,096 lbs curb weight
Spec Red Flags: Warning Signs in the Numbers
When comparing car specs, watch for red flags. A heavy car with small brakes can cause brake fade during hard stops.
Heavy Vehicle + Tall Gearing + Small Brakes = Performance Problems
A car with tall gearing may have slow acceleration. Narrow tires can also limit grip, affecting handling. Knowing these issues can help you choose wisely.
Winter Driving Addendum: Cold Weather Performance Factors
As winter comes, knowing how cold weather changes your car’s performance is key. Cold temperatures can make your car act differently on the road. It’s important to know what affects its performance during this time.
Cold Air Density Effects on Power Output
Cold air is denser than warm air, which can make your engine’s power go up. This is because engines need more air when it’s cold. This can give a small boost in horsepower. But, this boost is more for naturally aspirated engines than for turbocharged or supercharged ones.
Tire Temperature and Traction Realities
Tire temperature is key for traction in winter. Cold tires have less grip, which can hurt your car’s speed, braking, and turning. Winter tires help, as they stay flexible and grip well in cold.
AWD Capabilities and Limitations in Snow
All-Wheel Drive (AWD) systems help a lot in snowy conditions. But, it’s important to remember that AWD is not a replacement for winter tires. AWD helps send power to the wheels with the most grip. But, it can’t make up for the lack of tread compound flexibility and tire design for snow.
Ground Clearance and Salt/Rust Considerations
Ground clearance is important in winter, for driving through snow or salted roads. Higher ground clearance protects your car’s underside from damage from road salt and debris. Also, checking for rust regularly is key, as salt can make metal corrode faster.
Understanding these cold weather performance factors helps you get your car ready for winter. It helps you make better choices about maintenance, tire selection, and driving techniques.
Conclusion: Becoming a Car Spec Analysis Expert
Now you know how to read car specs like a pro. It’s time to use this knowledge. Make a checklist to compare cars by specs. This guide will help you make smart choices when buying a car.
Knowing about power-to-weight ratios, gearing, and aerodynamics can change your driving. Whether you’re looking at sports sedans or hot hatchbacks, you’ll make better choices. Your skills will help you find the perfect car.
Being a car spec analysis expert makes buying a car easier. You’ll know how to pick the right car based on its specs. Start using your knowledge today. Become a more informed car buyer by mastering car specs.